The following links are to substantial sources (mostly U.S. government) on the subject of climate change. Particular effort is made to source from the two principal United States federal government agencies tasked with monitoring and studying the atmosphere and climate:
|
A few other sources are cited sparingly:
|
|
| UPDATE, 2025: The Trump Administration -- emphatic in their denial of human-caused climate change -- has made a point of purging government websites of any contradictory evidence. Consequently, these NOAA & NASA graphs are, in most cases, no longer visible at their original sites. However, they are visible here. However, the pages of government info, to which they originally linked, may no longer exist -- except in archives outside of the current federal government. | ||
What's the difference between
global warming
and climate change?
NOAA at Climate.gov
This article explains that climate change not only includes global warming, but also the effects of it, such as melting snow and ice, rising seas, extreme weather, droughts and wildfires.
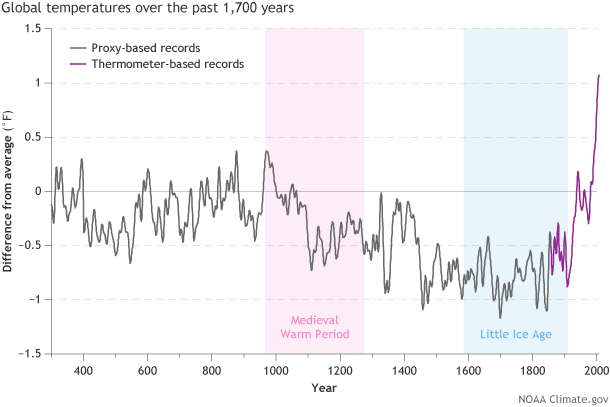
NOTE: The term "proxy-based records" refers to scientific evaluations of evidence in old ice and other natural sources (particularly ice cores taken from polar ice caps, glaciers, the Arctic circle, and high mountains, where the ice has remained frozen solid for centuries. It's getting harder to find such sites, as the planet warms.) Other sources include tree rings, corals, soils and ocean sediments.
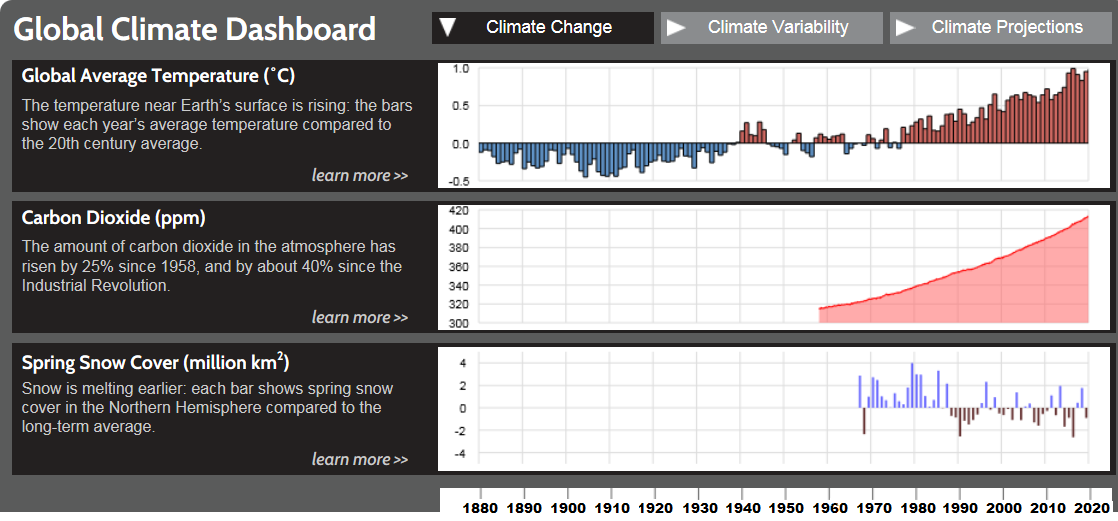
Climate Change: Global Temperature
NOAA at Climate.gov
-- and 7 of the 10 have occurred just since 2014."
 UPDATE, 2024:
Graphic:
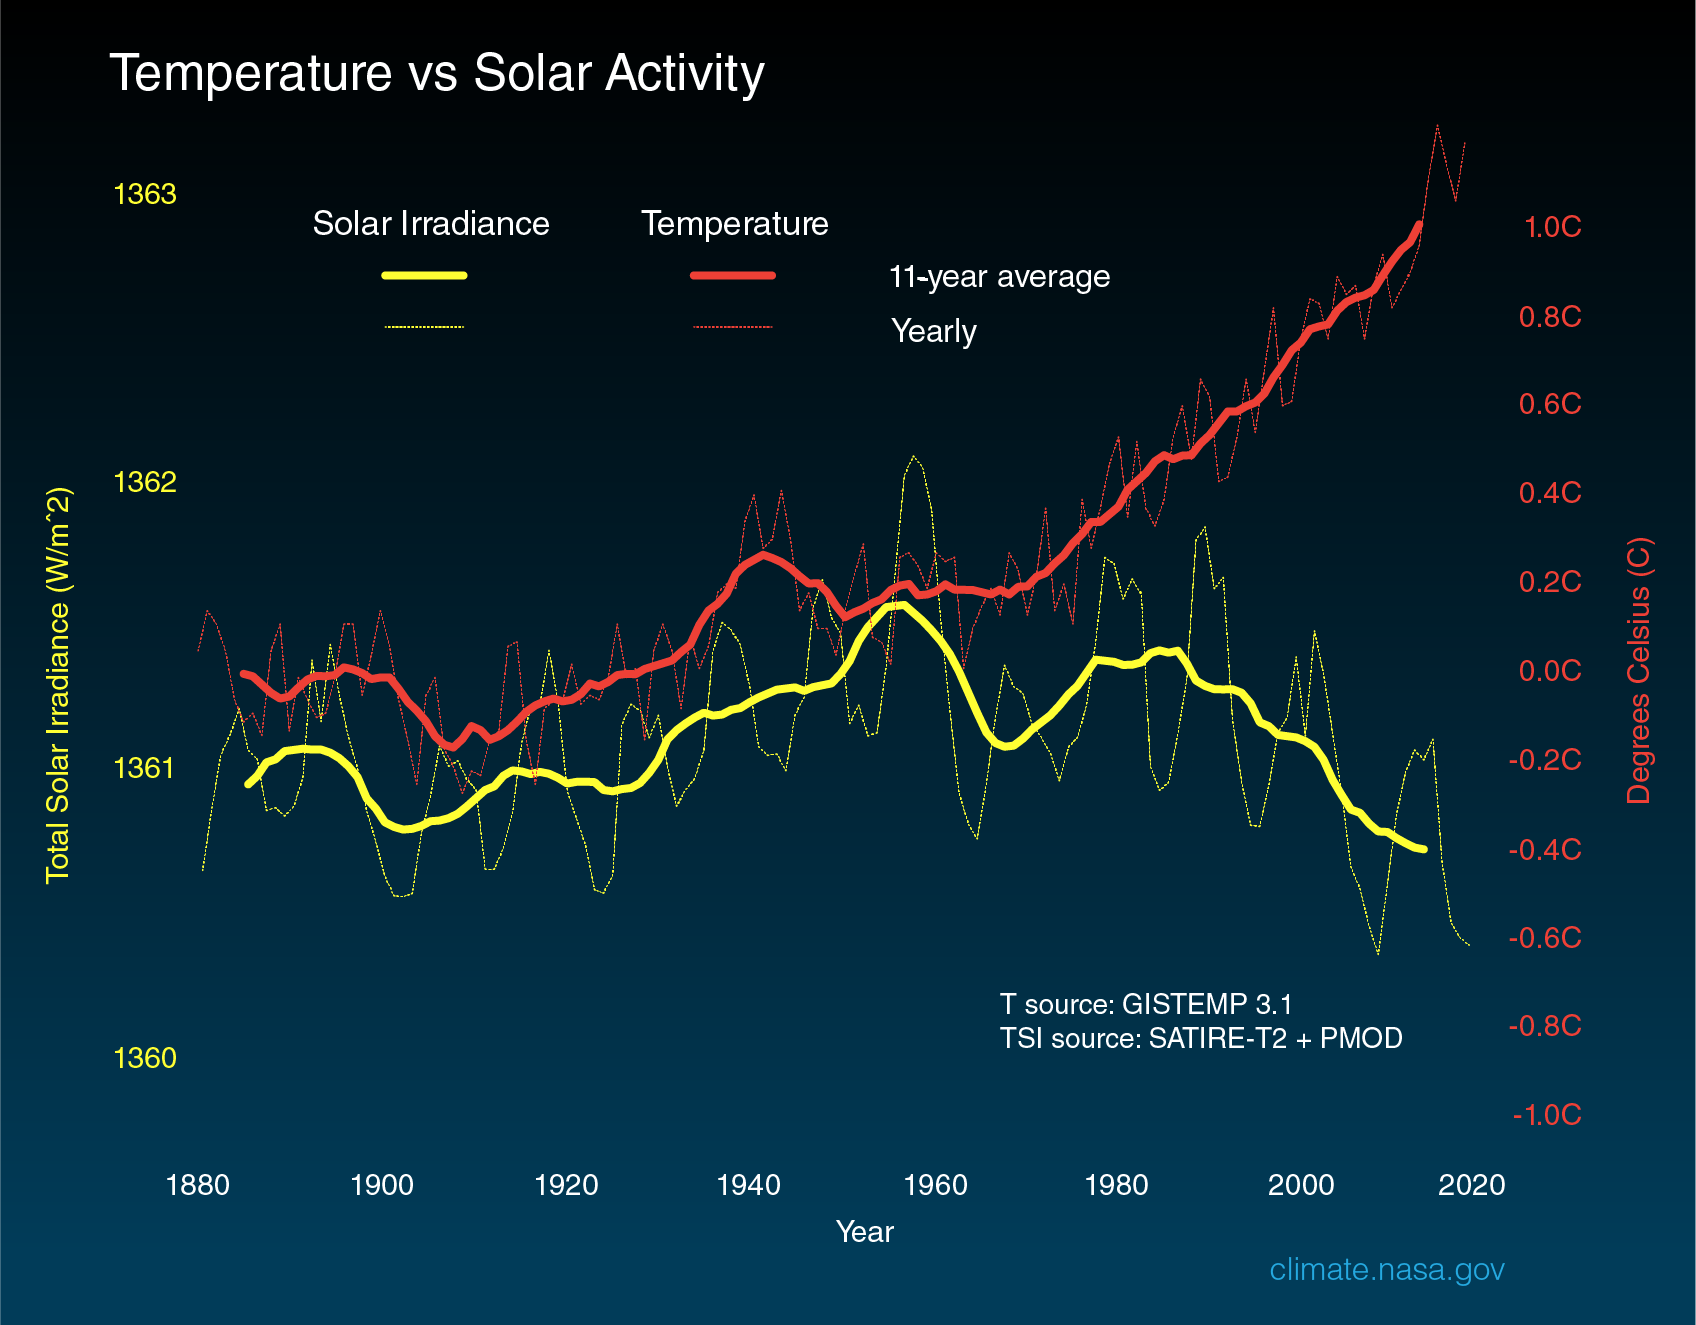
Temperature vs. Solar Activity
source: NASA
|
While some argue that solar energy is to blame for the global temperature rise, that is not the scientific record. Solar energy hitting the earth, which fluctuates on the sun's 11-year natural cycle, has (on average) remained fairly consistent, since 1880, and has recently even begun declining.
Did global warming stop in 1998?
This article explains the unusual confluence of natural factors that slowed (but did not stop) the global temperature rise during 1998-2012. (It serves also as a helpful explanation for many of the short-term transient fluctuations in global temperature, throughout time). Some of the causes of the fluctuation are detailed below :
 It also shows how -- although atmospheric temperature rise slowed from 1998 to 2012 -- the rising heat was, instead, largely being absorbed by the ocean (which, owing to far greater weight, can hold far more heat energy than the air).
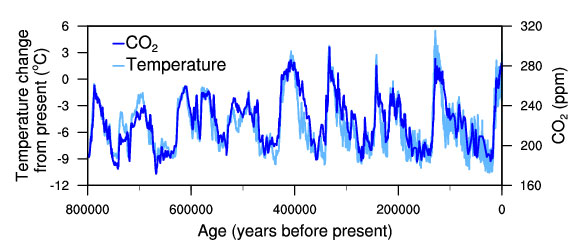
THE CO2 CORRELATION:
Temperature Change &
Carbon Dioxide Change
National Centers for Environmental Information, NOAA
Describes and graphs the correlation between the 800,000-year historic record of carbon dioxide in the atmosphere, and global temperature -- as determined from ancient air bubbles trapped in ice core samples and various other sources.
If Earth has warmed and cooled throughout history,
what makes scientists think that humans
are causing global warming now?
NASA Earth Observatory
...and eight years later:
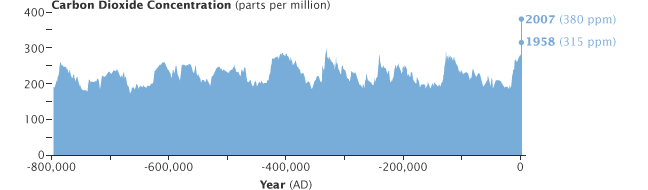
Climate Change:
Atmospheric Carbon Dioxide
NOAA at Climate.gov
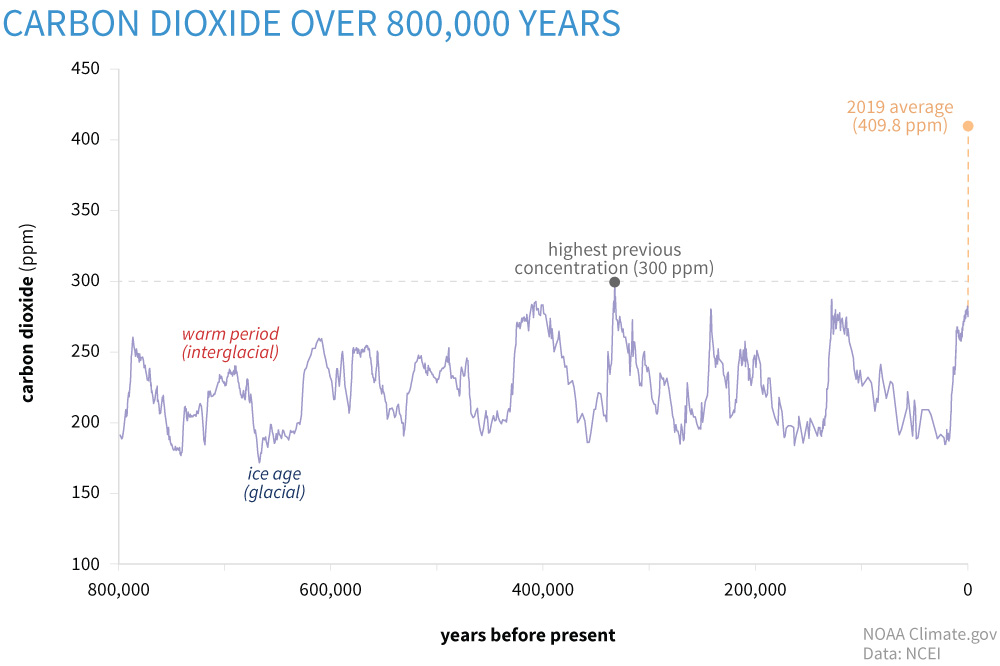 Notes (and graphs) the 800,000-year geologic/ice record of CO2 concentrations in the atmosphere (which have generally fluctated between 180 and 280 ppm) --
but marks the 2015 record of 409 ppm.
Notes (and graphs) the 800,000-year geologic/ice record of CO2 concentrations in the atmosphere (which have generally fluctated between 180 and 280 ppm) --
but marks the 2015 record of 409 ppm.
UPDATE:
 Notes (and graphs) the last 250 years of human existence -- starting in 1750 (at the beginning of the development of modern technology).
Graph shows the noticeable upswing in both carbon dioxide and atmospheric temperatures with the beginnings of the Industrial Revolution (late-1800s), and the sharp upswing with modern industry in Europe, America and Japan in the 1930s/1940s (World War II), then accelerating upwards to the present, as the whole world industrializes.
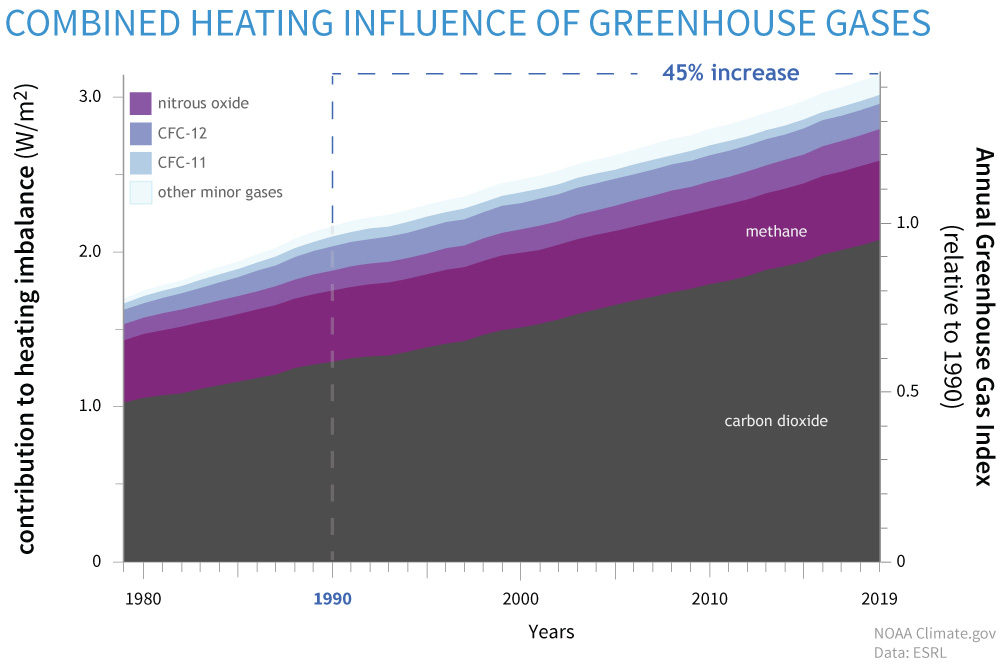 ...and includes this graph that shows
Climate Change Indicators:
Global Greenhouse Gas Emissions
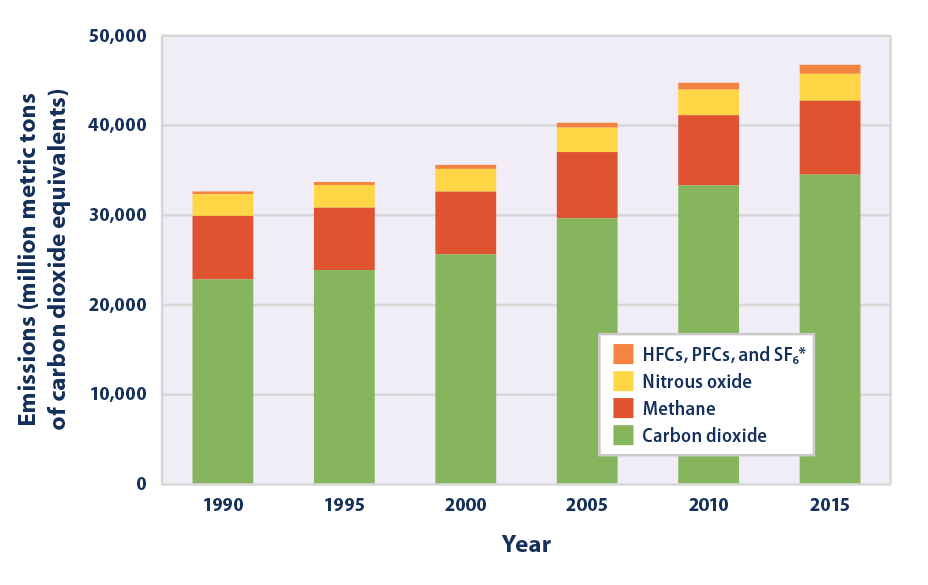
1990-2015
EPA
An overview of "greenhouse gas" emissions, 1990-2015,
as calculated from various sources.
Note carefully: While the graph (in green bars) shows actual tons of carbon dioxide dumped into the atmosphere, the other colors show the carbon dioxide equivalent (in terms of their effect on climate temperature) of the other gasses -- not their actual amounts in the atmosphere. For instance, methane actually exists in the atmosphere in a tiny fraction of the amount of carbon dioxide. But methane is a FAR more potent "greenhouse" gas. So just a "sliver" of methane in the atmosphere has as much impact as a huge chunk of carbon dioxide. Hence, methane is shown as a big orange chunk -- its size based on scientific studies and calculations.
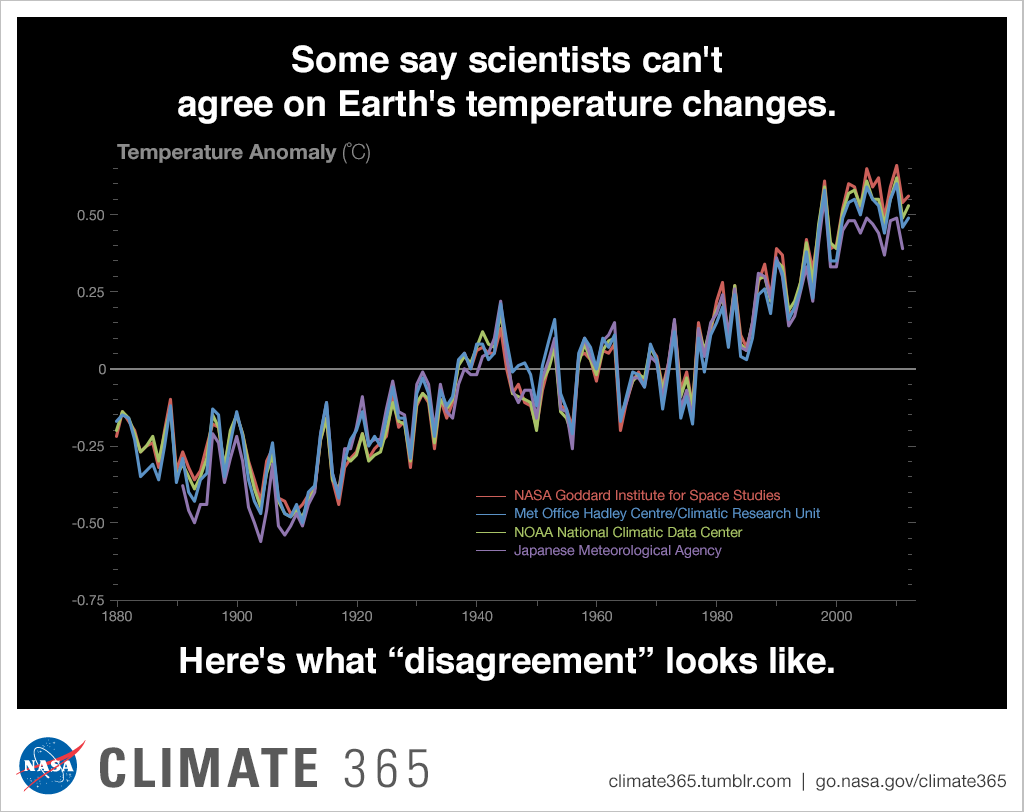
Agreement by multiple science agencies on Earth's temperature changes since 1880.
NASA
"Examining the Scientific Consensus on Climate Change"
study by
Peter T. Doran & Maggie Kendall Zimmerman,
Earth and Environmental Sciences Dept.,
University of Illinois at Chicago
in
Eos, Vol. 90, No. 3; January 20, 2009
(for free download from Wiley.com, click here.)
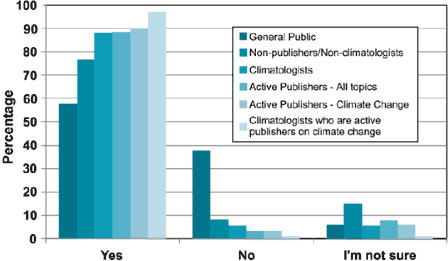
This survey attempted to provide a neutral, standardized survey of earth-science scientists, to determine the extent to which they believed that global warming exists, and is partly man-made.
The survey was sent to thousands of U.S. geoscientists who contract with the U.S. government or who are at a U.S. university (90% of respondents) -- and geoscientists from other countries (10%). The researchers sent the survey to 10,257 Earth scientists:
The contact list came from a Keane & Martinez document [2007], listing...
The main questions:
The web-based survey gained 30% response rate (typical of such surveys), with a total of 3,146 respondents.
PUBLIC DISAGREEMENT with MOST SCIENTISTS:
Of ALL scientist-respondents,
and
HOWEVER...
those more specialized in climate science,
and those more actively publishing "peer-reviewed" scientific research,
(research independently evaluated-and-validated by other scientists)
were even more likely to give those responses.
Of all responding climate scientists who are actively publishing on climate change,
By comparison,
a recent Gallup poll
found indications that
only 58% of the general public
would answer "yes" to Question 2.
The 'Scientific Consensus on Climate Change':
Doran and Zimmerman Revisited
by Murray Goot, Macquarie University
![]() A concise (but incomplete) rebuttal of climate-change deniers,
A concise (but incomplete) rebuttal of climate-change deniers,
addressing their most common arguments,
(citing major scientific sources in response) is found at:
Common Denier Arguments
Governor's Office of Planning and Research
State of California
(Click on each argument to see a scientific response,
generally with links to sources.)

"The Science of Why We Don't Believe
Science"
by Chris Mooney, Mother Jones, April 18, 2011
Although this is in a liberal publication, and chiefly cites conservatives as resisting science, it also cites examples of liberals rejecting science. It explains the notion of "motivated reasoning" -- picking the facts you want to consider, and how you consider them, to support the conclusion you want to believe. It points out how bias can (consciously or unconsciously) intercept and control your reasoning, and even substitute for it.